
Industrial water monitoring
For factory teams managing process water, cooling and washdown. See where water goes, compare use with production and act on flow that continues after hours.
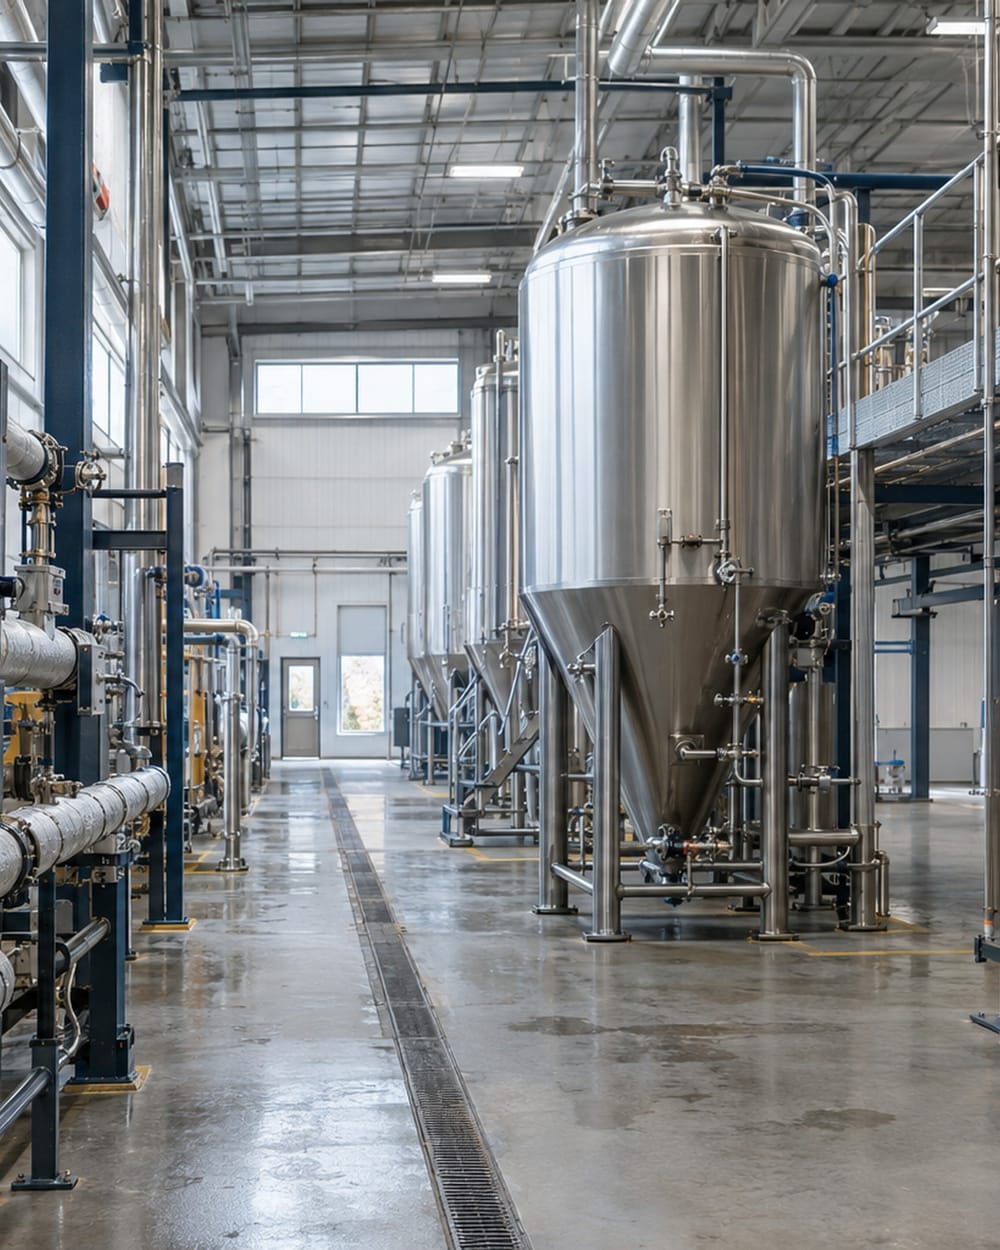
From site visit to ongoing review
v2-1- 01
Walk the facility with our team and show us the water use you want to understand.
- 02
Review the incoming meter and the process lines that need separate water readings.
- 03
Agree access, gateway placement and the installation sequence around your operating schedule.
- 04
Connect the instruments and bring the agreed readings into the dashboard.
- 05
Review the baseline together, then agree alert conditions, recipients and reports.
- 06
We stay on to review readings with your team and follow what changes after adjustments or repairs.
What we install
We connect compatible existing water meters and add flow meters at the process lines you need to see separately. Factory water submetering brings the incoming supply and those process readings into one dashboard.
Our wireless sensors send readings through 900 MHz radios, including Digi XBee, to a site gateway. The gateway connects those readings to your centralized dashboard.
We check instrument outputs, access and the wireless path during the site visit. Together, we agree the monitoring points, gateway connection and installation sequence around your operating schedule.
What to have ready
v2-2- Arrange access to the meter room and the process lines we are reviewing.
- Show us a mains outlet for the gateway near the proposed installation point.
- Walk the proposed antenna positions with us so we can check the wireless path.
- Include someone who knows the production, cleaning and cooling schedules.
- Gather existing meter and register models, output details and pulse weights where available.
The gateway can use a separate cellular connection and buffer readings locally during an internet interruption. We agree the connection with your team.
Can we use what is already there?
v2-3We check the instrument model, enabled output and measurement unit before specifying a connection. The rows below show what to bring to that discussion.
| Output or reading | What we connect | Typical example or check |
|---|---|---|
| Pulse | A counter matched to the meter’s pulse output. | Confirm the pulse weight and the detail needed at low use. |
| 4-20 mA | An input matched to the instrument’s output range. | Confirm what the signal measures and how its range maps to the displayed unit. |
| Modbus | A compatible read-only connection to the available readings. | Confirm the available values and their units with the controls contact. |
| Encoder | A compatible reader or Signalizer for the register protocol. | Check the register model and protocol, as well as the meter model. |
When water keeps running
Compare the flow trace with the expected idle baseline. A sustained difference gives your team a reason to check the process.
An alert prompts a flow check
- After hours
- Idle baseline
What your team sees
v2-4Your team sees incoming flow beside an overnight reference, making continuing use easier to review with the operating schedule.
| Interval | Municipal supply (L/min) |
|---|---|
| 18:00 | 263 |
| 18:30 | 264 |
| 19:00 | 268 |
| 19:30 | 267 |
| 20:00 | 270 |
| 20:30 | 265 |
| 21:00 | 268 |
| 21:30 | 268 |
| 22:00 | 46 |
| 22:30 | 49 |
| 23:00 | 41 |
| 23:30 | 53 |
| 00:00 | 52 |
| 00:30 | 41 |
| 01:00 | 44 |
| 01:30 | 40 |
| 02:00 | 50 |
| 02:30 | 47 |
| 03:00 | 510 |
| 03:30 | 515 |
| 04:00 | 508 |
| 04:30 | 217 |
| 05:00 | 215 |
| 05:30 | 207 |
What your team gets
You get a live dashboard showing water use at the agreed monitoring points. We record a baseline across operating and idle periods so your team can compare readings after a schedule change or repair.
We configure alerts to phones and email around the conditions your team needs to know about. You choose the recipients, operating schedule and response to each alert.
Reports give your team a record to review alongside operating changes. Our team stays involved after installation to review the readings and adjust the monitoring as your needs change.
Who acts on an alert?
v2-5Use these examples to agree the trigger, the people to notify and the first check. Our team reviews your builder request before configuring the monitoring. Select the device and unit for your facility in the builder.
Water continues after hours
Trigger: Flow stays above the agreed idle threshold during the selected hours. Notify: The facilities contact responsible for water use. First check: Check the production and cleaning schedule, then the processes still drawing water.
A process keeps drawing water
Trigger: A selected process meter stays above its agreed flow threshold after the process is scheduled to stop. Notify: The process owner and maintenance contact your team selects. First check: Check the process schedule and valves serving that line. Adapt the water recipe to this meter and its hours.
A water sensor stops reporting
Trigger: The selected sensor stays inactive beyond the agreed interval. Notify: The monitoring contact your team chooses. First check: Check device power, batteries and the radio path.
Case studies
Carlsberg’s water reduction covers 2023 to 2024. Jeff Inkes, PDI Bulk’s general manager, reported the annualized cost reduction from water and compressed air together.
WaterBreweries & BeverageFood & beverage processing
Sub-metering a brewery, and taking more than 100,000 m³ off its water use
Carlsberg Canada
Between 2023 and 2024 water use at the Carlsberg Canada brewery fell by more than 100,000 m³, and the Region of Waterloo gave the site its 2024 Water Efficiency Excellence Award for it.
100,000 m³2023 to 2024
Compressed airWaterFood & beverage processingBulk Handling & Rail Logistics
More than $150,000 a year, taken out on the dashboard data
PDI Bulk
Metering PDI Bulk's water and compressed air showed where both were going, and within weeks the general manager had taken more than $150,000 a year out of operating costs on process adjustments alone.
$150,000per year
Funding to review with your team
v2-6Your location and project scope determine which programmes are relevant. We help define the measurements and assist with paperwork alongside your team.
Water Efficient Technology (W.E.T.) Program
Region of Waterloo
For facilities on municipal water in Waterloo Region, review the water-conservation project support.
Water Smart Business Program
City of Guelph
For Guelph businesses with a City-administered water account, review support for permanent water-conservation changes.
Read before the site visit
v2-8Work through the water-use checks, then see what a pulse counter needs from an existing meter.
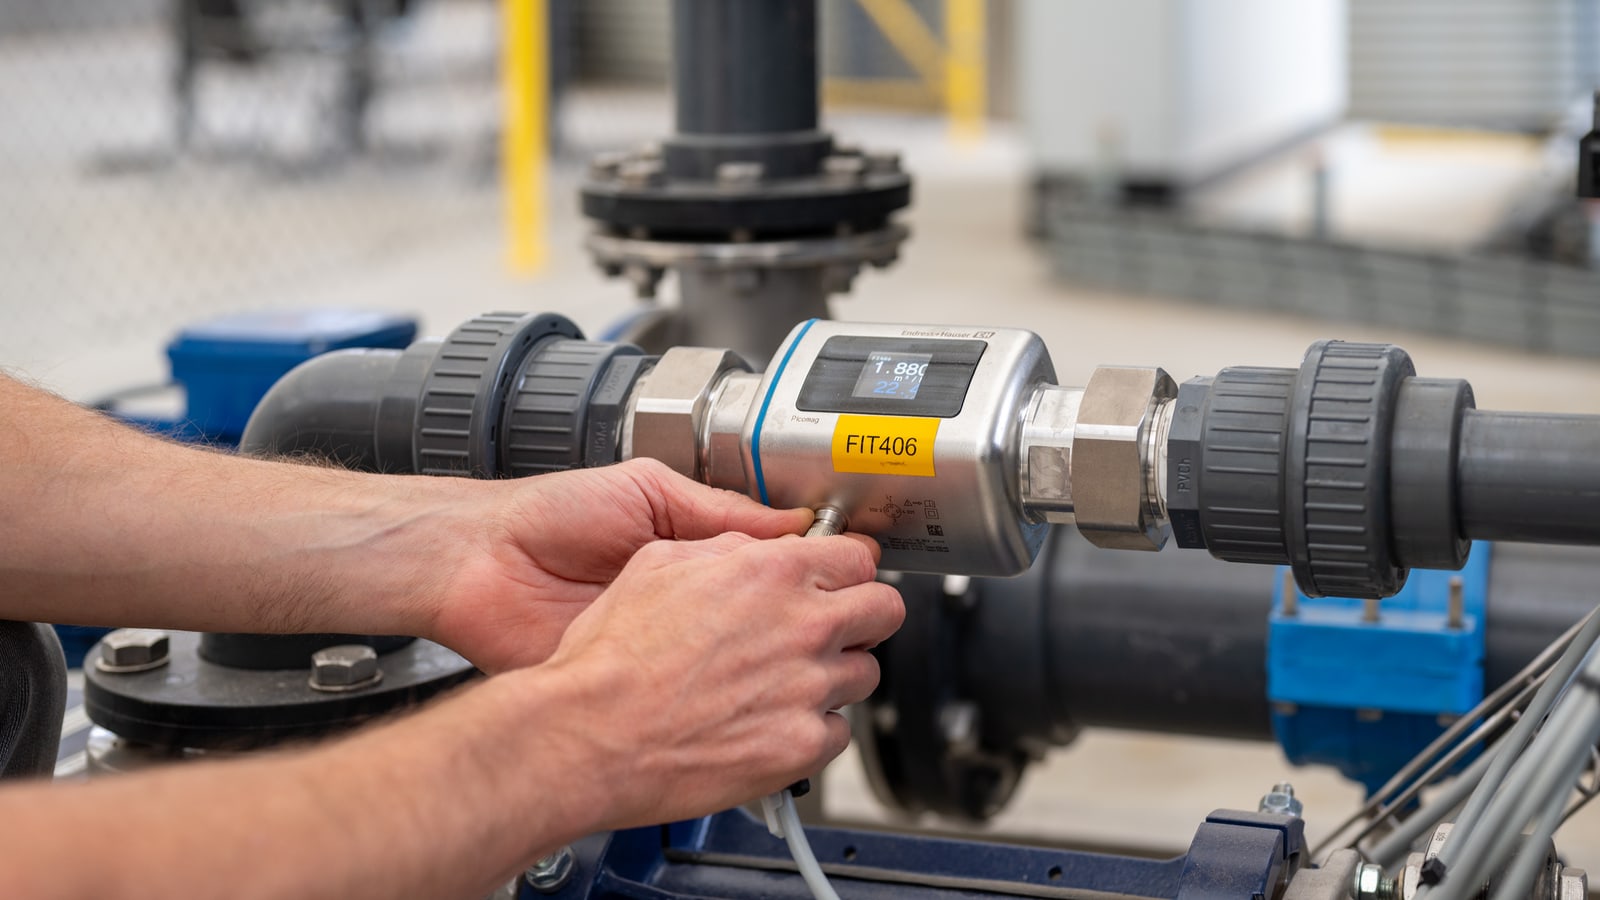
7 practical ways to reduce water use in a manufacturing facility
We work through seven checks that help facility teams understand water use, investigate unexpected flow and follow the effect of changes.
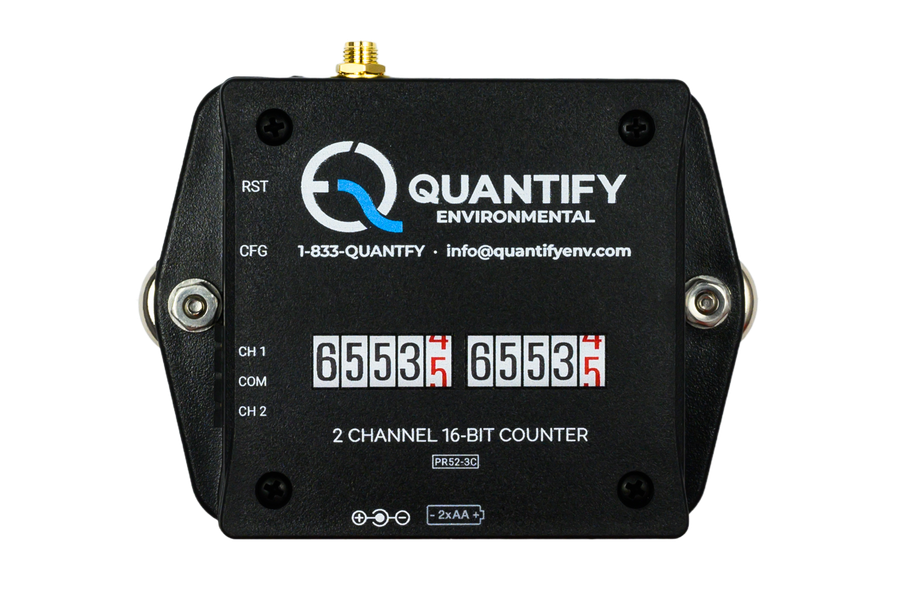
Sensor spotlight: the pulse counter
A pulse counter brings readings from a compatible existing meter into the dashboard, helping your team follow use over time.
Common questions
Can you connect our existing water meters?
We connect existing water meters when they have a compatible output. Pulse, 4-20 mA and Modbus are signal paths we work with; the available output depends on the meter and its configuration. We check that during the site visit.
Where should we add water submeters?
We choose submetering points around the water uses your team needs to manage. The incoming supply gives the overall view, while selected process lines show where use changes. Cooling, washdown and production schedules help us decide where the detail matters.
How do you flag water running after hours?
We configure an alert for flow that stays above the agreed idle baseline during the hours you select. Your team chooses the recipients and reviews the process when the alert arrives. A continuing flow reading is a reason to investigate its cause.
How is the installation planned?
We plan the installation with your operations team after checking the monitoring points. Meter access, pipework and available signal outputs determine the work required. We agree the sequence around the facility’s operating schedule.
What happens after the meters are connected?
Our team stays involved in reviewing the readings and refining the monitoring. You receive a live dashboard, a recorded baseline, alerts and reports. We use that record with your team to follow operating changes and repairs.
See where your water goes
Walk the facility with our team and show us where water use needs a clearer view. We will agree the measurements and connections to start with.
Book a site visitContact our team
or call 1-833-QUANTFY (1-833-782-6839)